ICT concept · Liquidity and the run on stops
Draw on Liquidity (DOL)
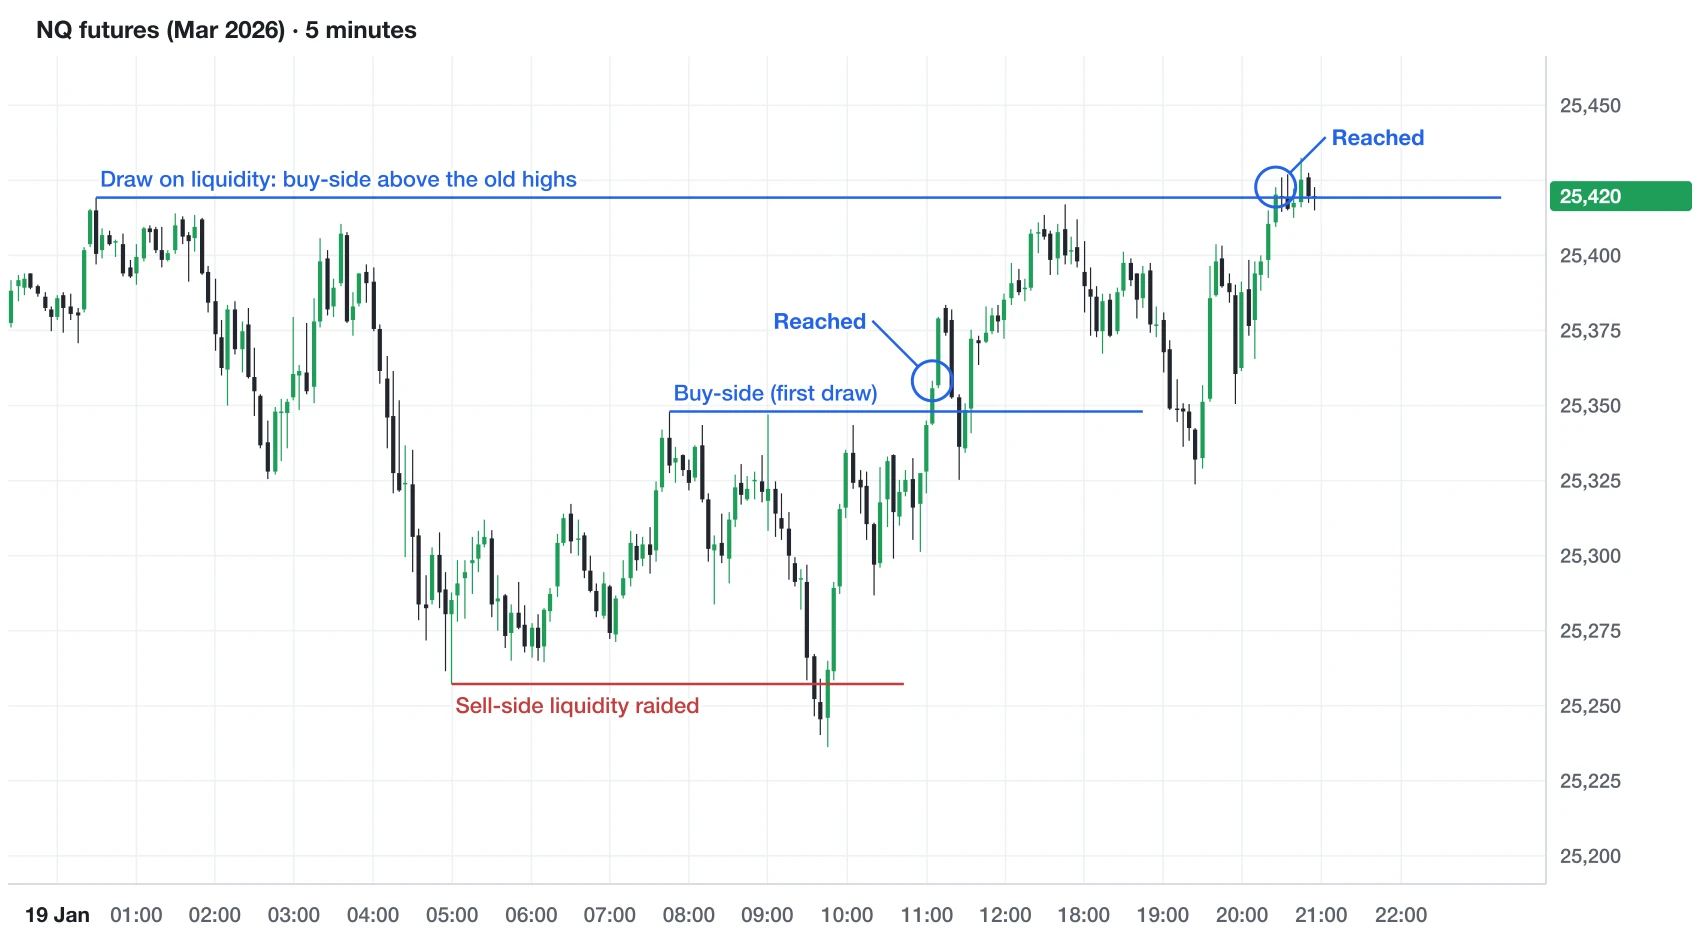
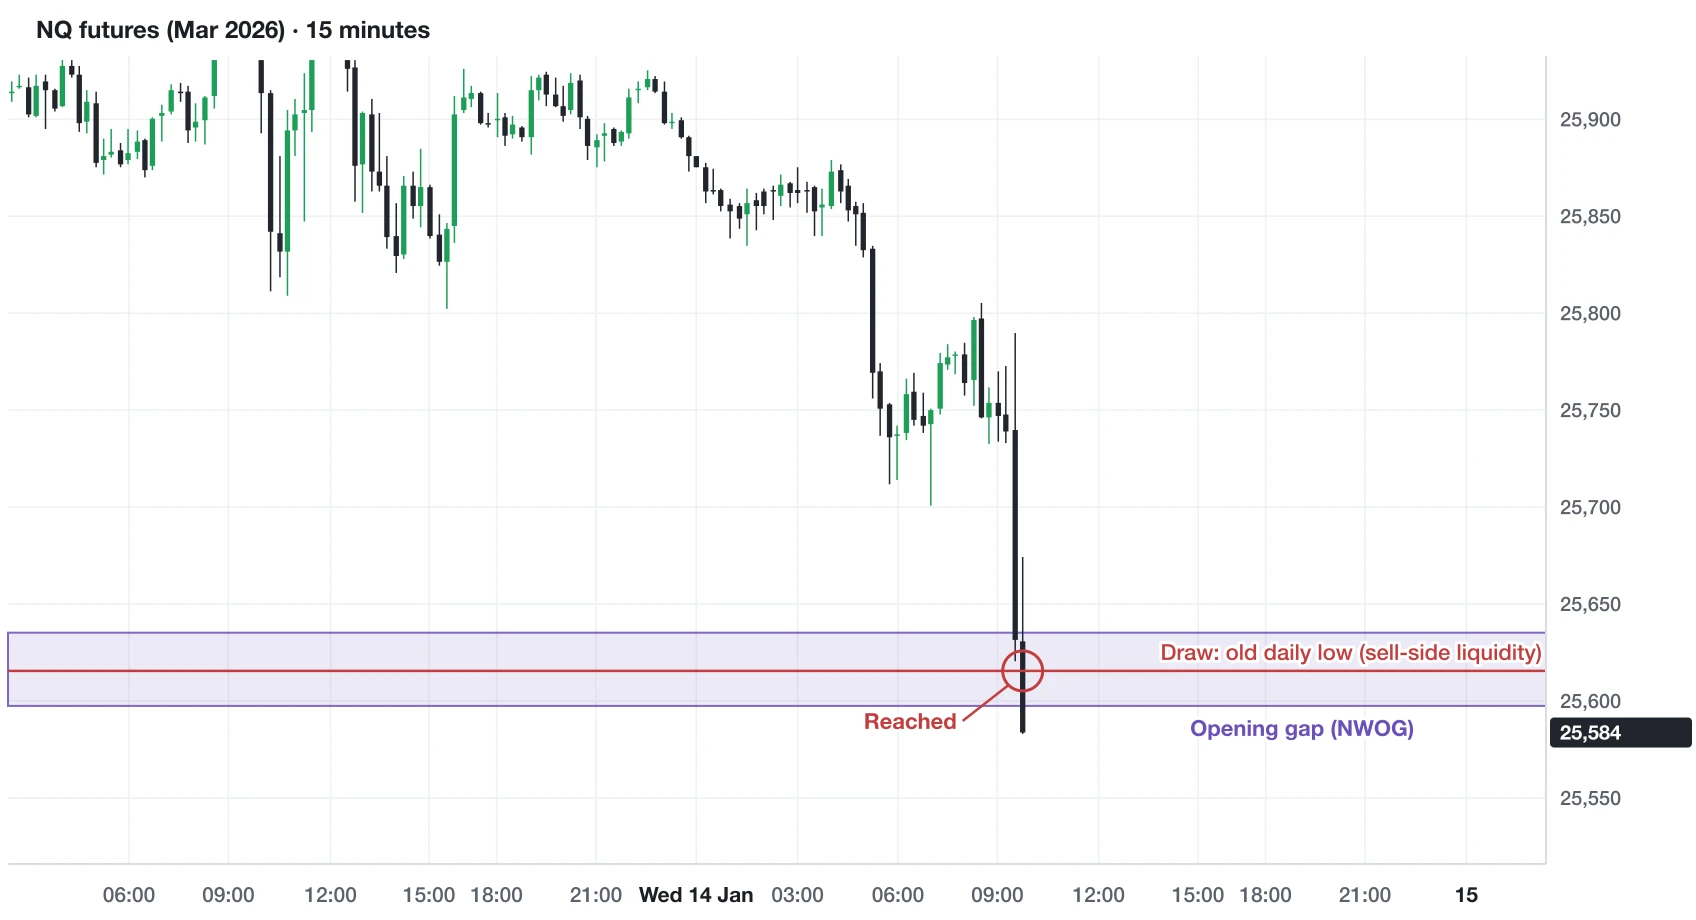
Where price seems to be heading next: a pool of stops above an old high or below an old low, or an open gap. A working assumption, not a promise.
Also written as Draw on Price
Updated
What is a Draw on Liquidity?
ICT puts two questions before every trade: where is the market going, and why should it get there. The answer is the draw on liquidity. It is an obvious pool of orders (buy stops above old highs, sell stops below old lows, relative equal highs or lows) or an imbalance price left open (a fair value gap, an opening gap), and price acts as if pulled toward it. Knowing the draw gives you the direction and the target; the entry patterns only tell you where to get in.
How to spot it on a chart
- Start on the daily and 4-hour charts: mark old highs and lows, the previous day's and week's highs and lows, and relative equal highs or lows.
- Mark the open imbalances too: fair value gaps and opening gaps price hasn't come back to.
- Ask which side price is more likely to reach: the one it is moving toward, the one the higher timeframe points to, and one not taken yet.
- Once a draw is reached, the next one becomes the question.
How traders use it for an entry
- Trade only toward the draw: buy toward buy-side liquidity, sell toward sell-side.
- Enter on a retrace to a PD array between price and the draw: in discount for longs, in premium for shorts.
- Use the draw as the target, and take some profit before it: price doesn't have to reach it for the trade to work.
What cancels it
- Price takes the liquidity on the other side and shifts structure the other way: the draw has changed.
- The draw has been reached: it is no longer a reason to stay in.
Common mistakes
- Holding for the draw no matter what: it is a reasonable target, not a promise.
- Picking a draw on a low timeframe that the higher timeframe disagrees with.
- Trading when you can't name the draw: if it isn't obvious, there is no trade.
In ICT's own words
Short excerpts from the lectures where ICT teaches it, each linked to the moment he says it.
“So the draw on liquidity is where's the market going and why should it get there. Those are the two questions that every trader should wrestle with every time they sit down and run their charts.”
“So that's the draw on liquidity, just think of it like a big magnet drawing price up towards it, okay.”
Track the Draw on Liquidity in your journal
daqverse is a trading journal for ICT traders. It does not find the pattern for you; it keeps a record of the trades you take from it, so you can see whether it works for you.
- When you log a trade, type Draw on Liquidity as a confluence: it becomes one of your concepts, ready to pick on every trade after, so each trade records the idea behind it.
- Write [[Draw on Liquidity]] or a #tag in a Flowstate note: the concept gets a page listing every note that mentions it, with one tap to add it to your concepts.
- Tag a Playbook model with it, and Concept Mastery shows how the trades taken on that model went.
- daqverse's Key Levels list the prior day, week and month highs and lows and the opening gaps, and filter them to the ones not swept yet: the candidates for the next draw. See Key Levels.
Questions
What is the difference between liquidity and a draw on liquidity?
Liquidity is any pool of resting orders. The draw on liquidity is the one price is most likely to reach next: the target your trade idea points to.
How do you find the draw on liquidity?
From the higher timeframes: mark the old highs and lows and the open gaps, see which way price is moving and which side hasn't been taken yet. The obvious one usually is the draw.
Related concepts
Liquidity Sweep
A quick move through an old high or low that sets off the stop orders resting there, after which price reverses.Premium and Discount
Split the current range at its middle, equilibrium: above it price is at a premium, where ICT looks to sell; below it at a discount, where he looks to buy.Fair Value Gap (FVG)
Three candles where the middle one moved so fast that the first and third never overlap: a gap price was delivered through on one side only.Opening Gap (NWOG · NDOG)
The gap between a session's close and the next open: the week's (NWOG, Friday close to Sunday open) and the day's (NDOG, 5 p.m. close to 6 p.m. open).ICT Silver Bullet
A time-based setup: a fair value gap that forms inside a set one-hour window on the New York clock, traded toward the nearest pool of liquidity.Power of Three (PO3)
Each candle is built in three steps: accumulation near the open, a false move the wrong way (manipulation), then the real move (distribution).
ICT (The Inner Circle Trader) teaches these concepts in his lectures. daqverse is a trading journal and is not affiliated with ICT: the explanations are our own words, and the quotes are short excerpts linked to the lecture.
Concepts to study, not trading signals; the charts are past price. Not financial advice. Risk disclaimer.
Keep exploring
- ICT trading journalA trading journal for ICT traders: every trade tagged with its New York kill zone and macro, a daily plan, a live session view and reviews by setup.
- ICT kill zone clockThe ICT kill zones and macros in New York time, live: which window is open now, the next one with a countdown, and the times in your own time zone.
- Flowstate study notesFlowstate keeps your trading study notes: a daily note beside each day's trades, linked pages and the concepts you are learning.
Journal your next Draw on Liquidity trade
daqverse is in early access: request a place and we email you an invite. Already invited? Log in.